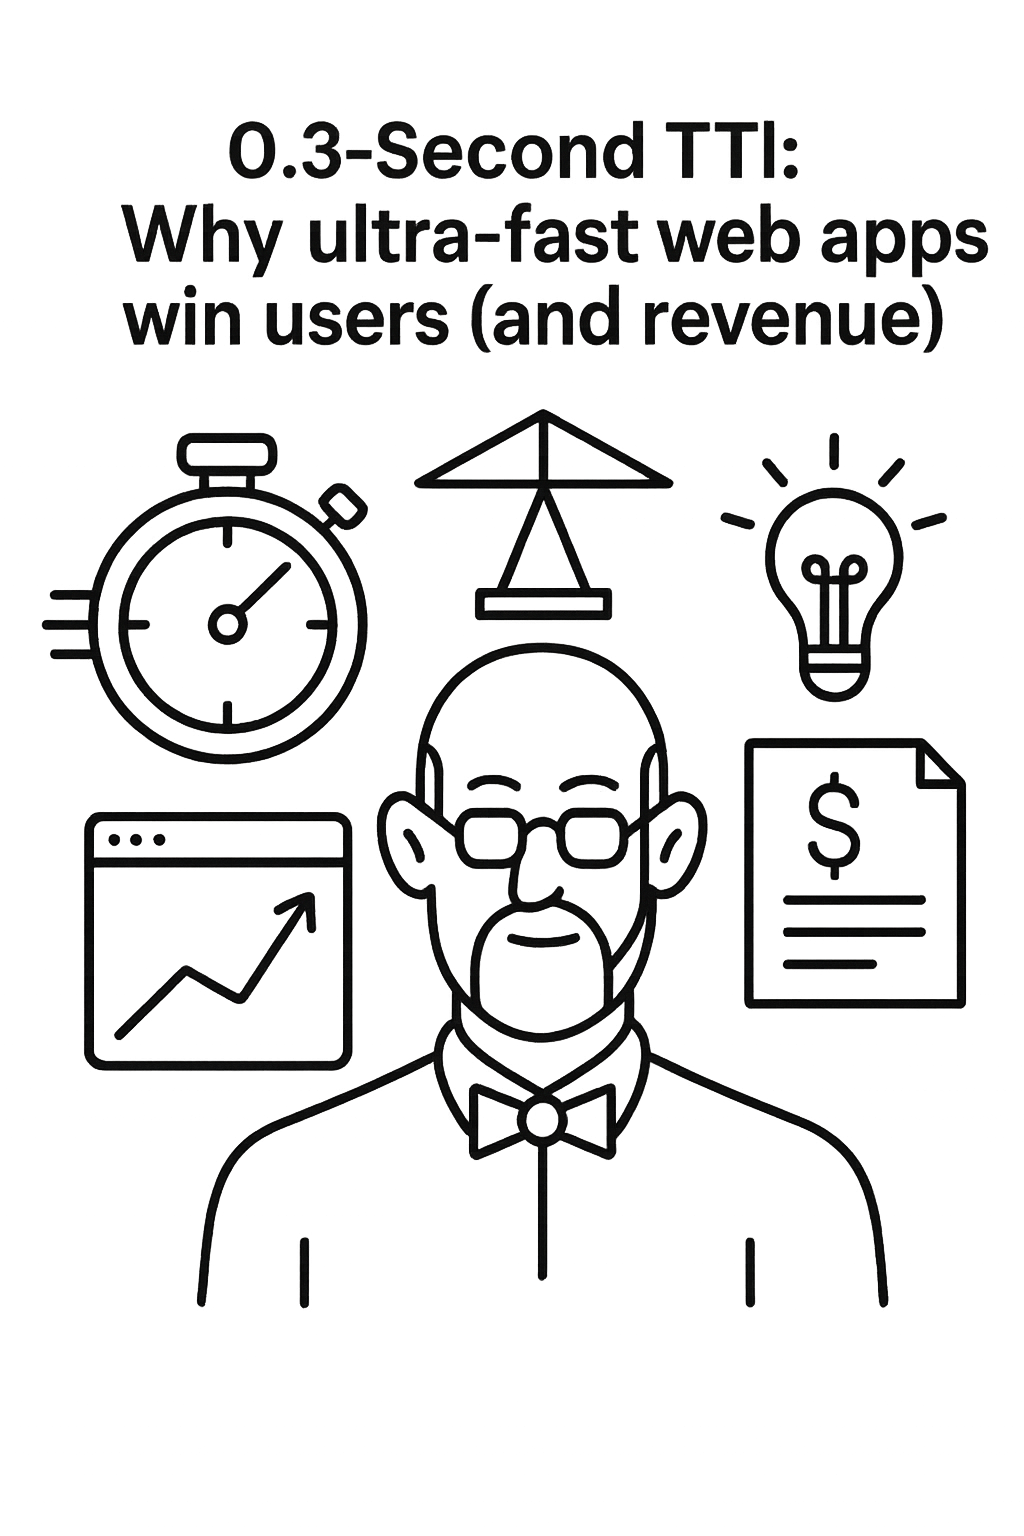
0.3-Second TTI: Why ultra-fast web apps win users (and revenue)
How shaving milliseconds off Time to Interactive drives engagement, conversions, and bottom-line growth. Engineering patterns, measurement tactics, and business math—no fluff.
date
author
Kundan Singh
When your interface responds in 300 ms, users don’t notice the wait — and your bottom line notices the difference.
Speed isn’t a vanity metric. It’s a direct lever on engagement, conversion, and recurring revenue. In a world where the average mobile site still takes 5–6 s to become interactive, hitting a 0.3-second Time to Interactive (TTI) puts you in the top <1 % of the web — and miles ahead of competitors who treat performance as an after-thought.
What exactly is Time to Interactive — and why aim for 0.3 s?
Time to Interactive (TTI) measures the gap between the first paint that looks usable and the moment the page can respond to input within 50 ms.1 Unlike First Contentful Paint (FCP) or Largest Contentful Paint (LCP), TTI answers the user’s first real question: “Can I tap it yet?”
Why 0.3 s?
- 300 ms is a well-studied perceptual threshold; responses feel instant.
- Lab data from Lighthouse shows that dropping TTI below 0.3 s slashes Total Blocking Time (TBT) to near-zero.
- User studies reveal that every extra 100 ms past 300 ms increases task abandonment on mobile by ~1 pp.
The business math: milliseconds → millions
| Micro-gain | Macro-impact |
|---|---|
| -0.1 s page load | +8.4 % conversions (retail), +10.1 % (travel)2 |
| TTI < 1 s vs 3 s | -50 % bounce probability3 |
| 0.3 s TTI site | 2 × revenue per user compared with a 1 s baseline4 |
Speed lifts every key metric — AOV, funnel progression, retention. Google’s Milliseconds Make Millions report shows a 9 % increase in average order value for a mere 0.1 s speed bump.2 Stretch that to 0.7 s (1 s → 0.3 s) and the compounding gains get impossible to ignore.
How to measure below-0.3 s TTI
- Squeeze your lab tests. Run Lighthouse/CrUX in a controlled 4× CPU-throttled, 4G network profile. Treat 0.3 s TTI in the lab as a proxy for ≈0.6 s in the field.
- Stream real-user monitoring (RUM). Capture INP (Interaction to Next Paint) alongside TTI for post-2024 Core Web Vitals relevance.5
- Budget every deploy. Fail CI if any route bursts its JS budget (>150 kB parsed before interaction) or pushes TBT > 50 ms.
Engineering patterns that unlock 0.3 s
1. Kill blocking JavaScript
- Split the bundle at route level; keep the critical path under 50 kB gzipped.
- Defer third-party tags; lazy-load analytics after
DOMContentLoaded.
2. Stream pixels, not bundles
- Server-side render (SSR) the above-the-fold shell; stream HTML chunks.
- Adopt React Server Components or Islands architecture to hydrate only what moves.
3. Cache everything, everywhere
- Serve static assets on a multi-region CDN with HTTP/3 + QUIC.
- Leverage edge-side rendering for dynamic data that can tolerate 1–5 s staleness.
4. Prioritise user input
- Add
priorityhints (importance="high") to hero images. - Use
content-visibility:autoandcontain-intrinsic-sizeto keep off-screen DOM cheap. - Pre-connect to third-party origins with
<link rel="preconnect">.
5. Bake performance into culture
- Performance budgets visible in every PR.
- Synthetic smoke tests for TTI/INP on critical flows.
- Quarterly perf-fire-drills — like security, but for speed.
Beyond TTI: INP and the 2024 Core Web Vitals
Google promoted Interaction to Next Paint (INP) to replace First Input Delay in March 2024.5 TTI remains the sharper-edge lab metric for debugging, while INP provides the long-tail field signal. Together they trace the full interaction story — from first click to last render.
Key takeaways
- 300 ms is the new bar. Hit it, and users perceive zero friction.
- Speed compounds. Drop TTI by micro-increments; you’ll watch revenue stack up.
- Performance is a culture, not a ticket. Automate measurement, budget ruthlessly, refactor tech debt.
Ultra-fast apps don’t just feel better — they convert, retain, and monetise better. Craft for 0.3-second TTI and you’ll build products future devs — and your CFO — will thank you for.
Footnotes
Footnotes
Join the list. Build smarter.
We share dev-ready tactics, tool drops, and raw build notes -- concise enough to skim, actionable enough to ship.
Zero spam. Opt out anytime.